

The 4 numbers your acquisition report is missing

Updated 23 Oct 2026•Published 23 Oct 2026
Key takeaways
- GGR measures revenue, not profitability, so two affiliates at €100,000 can deliver entirely different value.
- UK Remote Gaming Duty now takes 40% of remote gaming profits from UK customers, up from 21% in April 2026.
- Freeplays sit inside the duty base, which means promotional spend never reduces the tax bill.
- Attribute bonus cost to the acquiring channel instead of pooling it into a market-wide promotional total.
- Commission structures break apples-to-apples comparison, because CPA, revenue share, and hybrid deals price the same GGR differently.
- Trace payment costs to cohorts, since deposit behavior and market mix change processing economics between player groups.
- Blended averages hide losing channels, so calculate contribution per channel and per acquisition cohort.
iGaming is no different from any other business. Falling numbers on the balance sheet attract attention, while healthy-looking performance usually doesn't receive the same scrutiny. But that can create a costly blind spot in customer acquisition, particularly when a problem doesn't look like a problem at all.
Imagine one of your strongest channels has just delivered another good month. Players are arriving, GGR is healthy, and nothing in the headline numbers suggests it's time to pull the plug. If anything, the obvious conversation is about whether to spend more.
But what if that channel stopped making money two months ago?
There doesn't need to be anything wrong with the figures. The revenue is real, the players are real, and the report may be entirely accurate. The problem is the question being asked of it. GGR can tell you what those players generated. It can't, on its own, tell you whether acquiring them was profitable.
And that discrepancy becomes expensive when it goes unnoticed. A channel can keep generating revenue, keep looking productive, and keep receiving budget long after the economics behind it have changed.
So where did the profitability go? The answer isn't buried in an obscure financial model. It's often found in four familiar numbers that look very different when viewed alongside the acquisition channel responsible for them.
GGR isn't the problem. Asking it the wrong question is
GGR has good reason to be one of the most familiar numbers in iGaming. At a basic level, it shows the difference between the amount wagered and the winnings returned to players, giving operators an accurate view of the gaming revenue generated across a brand, market, or product.
But when you move from measuring revenue to deciding where to spend acquisition budget, that question changes.
Let's suppose, for instance, that two affiliates each generate €100,000 in GGR. From that number alone, there's little to separate them. Yet that doesn't mean both have made the business the same amount of money, or, in fact, that both have made money at all.
To understand that, we need to start accounting for what happened to the revenue along the way. How much was lost to tax? What was spent on bonuses and incentives? What did the affiliate relationship cost? And what did it cost to process player payments?
Those four numbers start to explain the difference between revenue generated and value retained.
| Cost | The question it helps answer |
|---|---|
| Gaming tax | How much of the revenue is lost to the applicable tax burden? |
| Bonus cost | How much promotional value supported that revenue? |
| Affiliate commission | What did it cost to acquire those players through the channel? |
| Payment cost | What did their deposits, withdrawals and other payment activity cost to process? |
1. Tax: how much of the revenue do you actually keep?
Tax is the first reason why €100,000 in GGR doesn't necessarily have the same value wherever it's generated. The rate an operator pays depends on the market, but so does the basis on which that tax is calculated.
Take the UK, for example. Since April 2026, Remote Gaming Duty has been charged at 40% of remote gaming profits generated from UK customers. Other regulated markets apply their own rates, definitions, and rules about what can be deducted before the tax bill is calculated.
That's significant when acquisition crosses borders. A campaign producing strong GGR in one market may leave considerably more behind than an identical performer elsewhere.
So comparing channels using a standard group-wide tax assumption is fundamentally inaccurate. Reporting needs to connect the revenue to the jurisdiction in which it was generated and apply the tax treatment that actually belongs there. Otherwise, the operator isn't comparing what those channels contributed after tax. It's comparing an estimate.
€100,000
taxable gaming profit
− €40,000
gaming tax (40%)
= €60,000
remaining
2. Bonuses: how much did you give back to generate it?
Next comes the promotional cost behind the revenue. Bonuses, free spins, cashback, and other incentives can all help acquire players and keep them active, but they also change the economics of the channel that brought those players in.
This is where two channels producing similar GGR can start to separate. One may attract players who deposit and continue playing with relatively little additional encouragement. Another might produce the same headline revenue but depend on more generous welcome offers, repeated bonuses, or other incentives to get there.
Neither is necessarily the better channel. The point is that GGR alone can't tell you which one is creating more value.
That makes bonus cost something that needs to follow the player back to the relevant acquisition source. If €18,000 of promotional value supported the revenue in our example, it belongs in that acquisition's commercial picture, not simply in a market-wide promotional total.
€60,000
remaining after gaming tax
− €18,000
bonus and incentive cost
= €42,000
remaining
3. Affiliate commission: what did those players cost you?
Affiliate performance can look impressive from the revenue side. But the more useful commercial question is what the operator paid to acquire the players responsible for it.
That cost isn't always straightforward to compare. One affiliate might work on a fixed CPA for each qualifying player, another on revenue share, while a third uses a hybrid of the two. Two partners delivering similar GGR can therefore have very different acquisition economics once their respective commercial agreements are taken into account.
Watch our video to learn how CPA, revenue share, and hybrid affiliate models compare.
There's also a time dimension. Paying heavily to acquire a player isn't necessarily a poor investment if that player continues generating value for months or years. What matters is whether the contribution eventually exceeds the acquisition cost, and how long that takes. This is where looking at groups of players according to when and where they were acquired starts to identify the real payback period.
For our example, let's assume €35,000 was attributable to acquiring these players.
€42,000
remaining after tax and bonuses
− €35,000
affiliate acquisition cost
= €7,000
remaining
4. Payment costs: what does moving their money cost?
The final number is easier to overlook because payments are often seen as an operational necessity rather than an acquisition cost. But getting money into and out of a gaming account isn't free, and those costs ultimately affect what the operator retains from the players it acquires.
DraftKings, for example, includes payment-processing fees and chargebacks among its variable costs of revenue, covering fees incurred on player deposits, withdrawals, and deposit reversals. In 2025 alone, its payment-processing expenses increased by $65.4 million.
At the channel level, the important point is that player groups don't necessarily transact in the same way. Payment methods, deposit and withdrawal behavior, transaction frequency, and the markets in which players operate can all influence processing costs.
That means two groups producing similar gaming revenue can still carry different payment economics. If those costs can be traced back to the relevant players and acquisition source, they provide the final piece of our contribution picture.
For our example, we'll assume €9,000 in attributable payment costs.
€7,000
remaining after tax, bonuses and acquisition cost
− €9,000
payment costs
= −€2,000
contribution
So, what happened to our €100,000?
Put the four numbers together, and the picture looks very different from where we started. Our apparently healthy €100,000 has become a €2,000 loss:
| Our example | Amount |
|---|---|
| Starting figure | €100,000 |
| Gaming tax | −€40,000 |
| Bonuses and incentives | −€18,000 |
| Affiliate acquisition | −€35,000 |
| Payment costs | −€9,000 |
| Total contribution | −€2,000 |
Note: These figures are deliberately illustrative. They aren't industry benchmarks, nor are we suggesting that €100,000 in GGR would normally produce these particular costs. Actual economics will depend on the market, tax treatment, acquisition agreement, promotional strategy, player behavior, and other operator-specific factors.
The point is simple. Looking at the original €100,000 alone, we couldn't tell whether the channel was highly profitable, marginally profitable, or losing money. Only when we attributed the relevant costs did we find out.
The real value appears when you start comparing channels
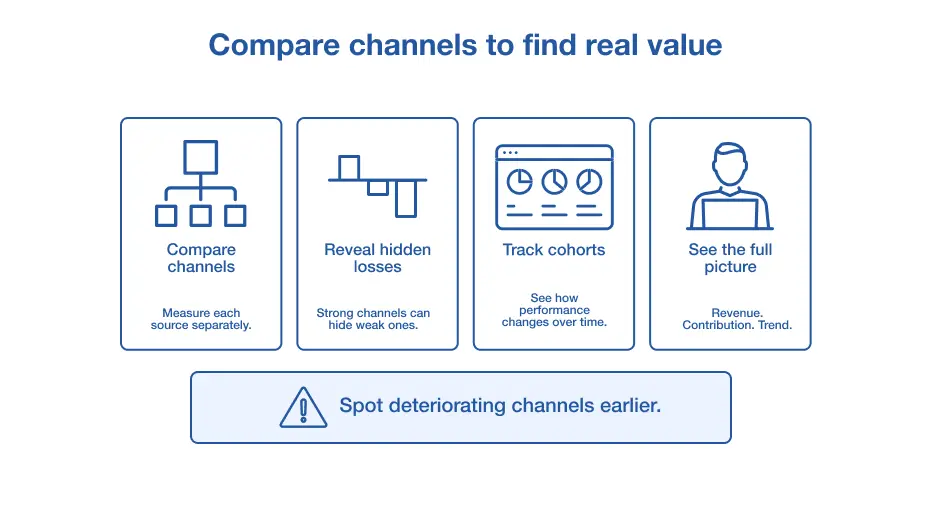
Calculating contribution for one acquisition channel tells you whether it made money. Calculating it consistently across every channel tells you something more useful: where the next round of acquisition budget is likely to work hardest.
This is where market averages can become misleading. Strong contribution from one source can compensate for weak or negative contribution elsewhere, leaving the overall result looking perfectly respectable. Unless you measure each acquisition source separately, strong performance from one can hide losses from another.
But even channel-level reporting only provides a snapshot. Affiliate A might have delivered excellent returns six months ago and be considerably less productive today. Comparing players by when they were acquired reveals whether that performance is changing and how long different groups take to recover their acquisition cost.
That gives operators three increasingly useful views of the same acquisition activity — that is, what revenue it generated, what contribution remained, and how that contribution developed over time.
And that last view can be the difference between recognizing a deteriorating channel now and discovering it several months later.
Can you get the answer before you spend again?
None of the calculations we've discussed are particularly difficult. Arithmetic isn't the problem. The challenge is having the right numbers connected at the right time.
This is where reporting technology makes the difference. Rather than pulling figures from separate systems and rebuilding the calculation manually, an integrated platform can connect revenue with the relevant tax treatment, promotional activity, acquisition source, and payment data. It can then segment that information by market, channel, or player group to show where value is actually being retained.
The benefit isn't simply a more detailed report. It's speed. Finance teams can spend less time reconciling figures, analysts can investigate performance without repeatedly assembling datasets, and acquisition teams can see changes in channel economics much sooner.
Discovering that a channel became unprofitable three months ago may explain what happened, but it doesn't recover the budget spent since. The real advantage, therefore, is having that knowledge before the next acquisition decision is made.
Popular blog posts